
v0.6.0 Performance
This page reports what Felix v0.6.0 does on real Azure hardware. It covers a single broker in detail, compares it with NATS JetStream on the same machines, and reports a three-broker cluster that keeps three copies of every durable record. Every condition is stated so the numbers can be reproduced, and every number comes from the cell data recorded in the repository.
The page is in this order:
- Summary
- How to read the numbers: what is counted, and the two kinds of latency
- Exact conditions for the single broker
- Single broker results
- Felix against NATS JetStream
- Three-broker cluster
- What limits each shape
- Known issues
- What the campaign found and fixed
- How we got here: the investigation behind the single broker numbers
Summary
Section titled “Summary”On one 8 vCPU broker with local NVMe, over QUIC with TLS, with 64 publishers on
four load generators. These single-broker figures were measured on the
campaign build (88a91681). The release build (6ec23a8f) was compared with
it on ten shapes: batched throughput matched within about 1% except 256 B
fire-and-forget, which is 13% slower on the release (#1469). The latency and
batch-1 rows moved between -5.4% and +4.5%, on one trial each
(details).
- 3.6 GB/s of 4 KiB messages fire-and-forget, losing nothing, and 4.4
GB/s acked with 64 requests in flight. Both are in-memory, in batches of 64,
with publishers waiting for room when the broker is full: fire-and-forget
through
FELIX_PUB_INGRESS_WAIT=1, acked because acks after the write (FELIX_ACK_ON_COMMIT=1) make a full broker hold an acked publish instead of refusing it. The broker shed nothing in either. - 4.2 GB/s on the shipped defaults, at most once. With the defaults the broker drops a fire-and-forget publish that arrives while it is full. It dropped 1.2 to 2.2% of what was sent. The publisher is not told.
- 1.40 to 1.48 GB/s durable, fsynced before the ack, at 4 KiB and 64 KiB
in batches of 64. That is the disk’s own rate: the same volume writes 1414
to 1426 MB/s in
fiowith an fsync after each write. - About a third of a millisecond for one durable publish, fsynced, when nothing else is running: 312 µs at p50 and 437 µs at p999 for 256 B. In-memory publishes take 160 to 180 µs.
- Felix has higher throughput than NATS JetStream in every acked and durable pair, from 1.2 times for in-memory single messages to 14.8 times for durable batches of small messages. Core NATS has about 1.35 times Felix’s throughput for fire-and-forget. With one publish in flight, NATS answers sooner in every pair, by 13 to 80 µs at p50. Both ran on the same VMs, interleaved.
- This build is as fast as or faster than v0.6.0-preview.9 on every shape in the gate, from +0.3% for durable to +32% for small acked messages.
On three 4-core brokers with three fsynced copies of every durable record, durable 4 KiB batches ran at 656 MB/s of payload, which is about 2 GB/s written across the three brokers’ disks, and in-memory 4 KiB batches at 4.6 GB/s. Publishing straight to each shard’s owner was 1.3 to 4.4 times faster than publishing through any broker. On a cluster whose fleet features are not yet finalized, a durable ack waits about 3.5 ms; Three-broker cluster explains why.
How to read the numbers
Section titled “How to read the numbers”What is counted
Section titled “What is counted”Throughput is measured at the broker, never at the clients. The broker records its counters once a second, and a cell’s number is the median one-second rate over the steady window (defined under How a number is taken). Three rates come out of those counters:
- Payload is the bytes of message payload the broker accepted. A publish the broker sheds is not counted. Every throughput on this page is payload unless it says otherwise.
- Append is the bytes written to the durable log: payload plus 28 bytes of record framing per record. It is what the disk has to absorb, so the durable rows give it next to payload. For 256 B records it is about 11% above payload; for 4 KiB records under 1%.
- Wire is the UDP bytes received on the broker’s QUIC ports, with QUIC, TLS and Felix framing. It is 2 to 3% above payload for 4 KiB batches and about 25% above it for single 256 B messages. It is mentioned only where it explains something.
Messages per second is payload divided by the payload size.
Two kinds of latency
Section titled “Two kinds of latency”A latency number means nothing without the load it was measured under. This page reports two regimes, and they answer different questions.
Service latency. One publisher sends one publish, waits for the ack, and sends the next. Nothing queues. This is how long the broker takes to do the work: receive, write, fsync if the stream is durable, answer. It is the number to use when you ask how long a publish takes. The unloaded latency table reports it.
Queueing latency. Under a throughput test the load generators keep a fixed number of publishes outstanding: here 64 publishers, each with 64 requests in flight. When that is more than the broker serves at once, the extra requests wait in line, and the wait dominates the time it takes to serve one. Little’s law says what the wait must be: the time a request spends in the system equals the number outstanding divided by the number completed per second. It does not depend on how fast any single request is served.
Take in-memory 4 KiB batches of 64, acked. Outstanding are 64 publishers × 64 requests × 64 records × 4096 bytes = 1.07 GB. The broker accepts 4.40 GB/s. Little’s law predicts 1.07 / 4.40 = 244 ms, and the measured p50 is 229 ms. The durable cell of the same shape completes 1.40 GB/s, so the prediction is 767 ms, and the measured p50 is 767 ms. Nothing in either cell is slow: the same broker answers a lone publish in under 400 µs. The ack time in a saturated cell measures how much the load generator chose to keep in flight.
The same law tells a client how much to keep in flight. Data in flight beyond
what keeps the broker busy adds no throughput, only waiting: a request waits
for everything queued ahead of it, so the wait is bytes outstanding ÷
throughput. Past that point, halving what a client keeps in flight halves its
latency at the same throughput. The client’s publish_inflight_bytes budget,
4 MiB by default, is the knob; see
client configuration.
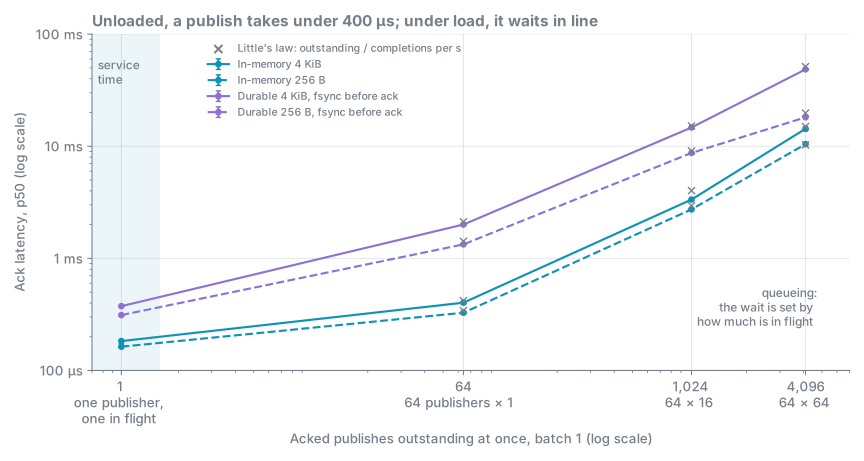
The chart shows both regimes in one picture. With one publish outstanding, the latency is service time: 160 to 380 µs. Every point to the right is queueing, and each sits close to the cross that Little’s law predicts from the throughput alone. The data is from Unloaded latency and Latency against offered load.
So the ack percentiles of a throughput test describe queueing under deliberate overload. This page reports them only to show the shape of the tail, and they are never the request latency of the system. Latency against offered load shows the move from one regime to the other as the in-flight count rises.
Exact conditions
Section titled “Exact conditions”Everything below was recorded by the campaign driver and is in the repository
under scripts/perf/azure/sessions/v060-w3-final-results/. The three-broker
cluster’s conditions are in its own section.
Hardware and network
Section titled “Hardware and network”| Part | Setting |
|---|---|
| Region | Azure westus3, one resource group, one virtual network |
| Broker | 1 × Standard_L8as_v4, 8 vCPU, 64 GiB, kernel 7.0.0-1017-azure |
| Broker storage | The VM’s local NVMe drives as one md RAID0, ext4 mounted noatime |
| Load generators | 4 × Standard_D4as_v5, 4 vCPU, 16 GiB |
| Control plane | 1 × Standard_D2as_v5 |
| NIC | hv_netvsc driver, MTU 3900 on every VM |
| Transport | QUIC over UDP with TLS, as in production. Every byte is encrypted. |
| UDP buffers | net.core.rmem_max and wmem_max 26214400, rmem_default and wmem_default 8388608 |
The device baseline was taken with fio on the broker’s data volume twice,
before each half of the campaign. Sequential 256 KiB writes with an
fdatasync after each ran at 1414 and 1426 MB/s with one job, 1467 and 1480
MB/s with four, and 1456 and 1478 MB/s with eight. Sequential 4 KiB writes with
one job ran at 80 and 46 MB/s. These are the ceilings the durable cells are
judged against.
The preflight refused to start until every VM reported MTU 3900 with
unattended-upgrades masked, each load generator could reach the broker with full
size packets, the broker’s data volume was the RAID0 device, and fio reached
at least the expected rate. All checks passed (final/preflight.txt).
The broker and the load generators run commit
88a9168148f6fab3245712ea8dee3dc110c9f778 of main, built with the release
profile and no extra cargo features. That commit contains four changes that
came out of the investigation in How we got here:
- #1414: a publisher waiting for ingress room is woken when a slot frees, one per slot, instead of all of them at once.
- #1415: the default ingress queue depth is 512 per executor instead of 64.
- #1418: the client opens 4 shared publish streams for a keyed stream by default, not 16.
- #1419: hot-path metric handles are cached instead of registered on every publish.
It does not contain #1421 (durable streams ack after commit by default), #1443 (a full ingress queue no longer stalls the connection) or #1460 (the load generator finishes its publishers gracefully). The page says where each of those matters.
The campaign also built v0.6.0-preview.9 (71960125bd9a9dee61115a7553f21342a1d136d1)
on the same VMs and ran it against this build as a gate on the headline cells.
A cell more than 3% slower than preview.9 would have stopped the campaign.
Settings
Section titled “Settings”The broker runs at its defaults except for the variables below, which the campaign sets on every cell.
| Variable | Measured value | Product default | Differs |
|---|---|---|---|
FELIX_ACK_ON_COMMIT |
1: every stream acks after commit |
unset: durable streams ack after commit from v0.6.0 (#1421), in-memory streams on enqueue | For in-memory streams |
FELIX_PUB_INGRESS_WAIT |
1 |
unset: fire-and-forget is shed when ingress is full | Yes |
FELIX_STORAGE_IO_URING |
1 |
0 |
Yes |
FELIX_DURABLE_FSYNC_MODE |
on_commit (periodic in the periodic latency cells) |
periodic, every 250 ms |
Yes |
FELIX_QUIC_LISTENERS |
4 |
derived from the core count: 4 on 8 cores | No |
FELIX_IO_RUNTIME_THREADS |
0 |
0 on Linux |
No |
FELIX_UDP_RECV_BUFFER, FELIX_UDP_SEND_BUFFER |
25165824 (24 MiB), broker and clients |
OS default | Yes |
FELIX_MTU_UPPER_BOUND |
3872, broker and clients (NIC MTU is 3900) |
4096 |
Yes |
The clients set only the two UDP buffer sizes and the MTU bound. They use no
connection pool override, no ack threshold override and no shard stream
override, so FELIX_PUB_SHARD_STREAMS is the default of 4.
What the durability settings promise:
FELIX_DURABLE_FSYNC_MODE=on_commit: the broker fsyncs before it answers an acked publish, and many waiting publishes share one fsync (group commit). A crash, including a power loss, loses nothing that was acknowledged.FELIX_DURABLE_FSYNC_MODE=periodic(the default): a background timer fsyncs every 250 ms (FELIX_DURABLE_FSYNC_INTERVAL_MS). A broker process crash loses nothing that reached the page cache, but a power loss or kernel panic can lose up to one interval of acknowledged records.FELIX_ACK_ON_COMMIT=1: an acked publish is answered after the write rather than when the broker accepts it. Withon_commitfsync the answer means “on disk”. Withperiodicfsync it means “written, fsync within one interval”. It also changes what a full broker does with an acked publish: it holds it for up toFELIX_PUBLISH_QUEUE_WAIT_MS(2000 ms by default) waiting for room, instead of refusing it at once.FELIX_PUB_INGRESS_WAIT=1: a fire-and-forget publish waits for ingress room instead of being shed when the queue or byte budget is full. It does not affect acked publishes. That is why the fire-and-forget numbers below are what the broker sustained, not what was offered. With the default, overload is shed and counted.
A separate set of cells (Shipped
defaults) runs with the
measured build’s defaults instead: ack on accept (FELIX_ACK_ON_COMMIT=0),
ingress wait unset and io_uring off. on_commit stays set in those cells so
their durable rows compare with the others.
Workload
Section titled “Workload”- Two streams with 48 shards each:
perf, an in-memory stream, andperf-durable, a durable one. - 4 load generators with 16 publishers each, 64 publishers in all. An acked publisher keeps 64 requests in flight unless a cell says otherwise.
- Keys are spread evenly over all 48 shards. The load generator asks the broker
for the shard count and names keys to hit each shard in turn. Some cells use
plain keys (
k0tok47) to show the effect of this choice. - Payloads of 256 B, 4 KiB and 64 KiB; batch 1 and batch 64; acked and fire-and-forget. A batch is one request carrying that many records.
- No subscriber is attached in the throughput cells. The latency cells attach one.
- Each throughput cell runs 90 seconds, and the generators start at a shared wall-clock time. The latency cells run one publisher on one generator for 2,000 warm-up and 20,000 measured publishes.
How a number is taken
Section titled “How a number is taken”The steady window is the time in which all four generators were running, less its first and last 10%. In a 90-second cell it is about 72 seconds. A cell’s throughput is the median one-second rate over that window. Per-generator rates are never summed: the generators start and finish at slightly different times and get unequal shares, so summing their averages misstates the true rate by a wide margin. For fire-and-forget the client-side figure is an enqueue rate and is not used.
Shed is what the load generators sent minus what the broker accepted, from their own byte counts at the end of the cell.
Headline cells ran three trials and the rest two, interleaved so drift in the VMs, the disk or the network hits every arm alike. Each number is the median of the finished trials; where trials differ by more than half a percent the range follows in parentheses. Durable cells start from a wiped data directory, a trimmed volume and a dropped page cache.
The latency percentiles come from each load generator’s own histogram. Ack latency runs from just before the publish is sent to when its ack arrives. Delivery latency runs from the publish to when the subscriber receives it.
Reproduce it
Section titled “Reproduce it”The driver is committed. It starts the session, runs the preflight, records the system facts, runs the gate, the matrix, the latency cells, the NATS pairings and the sweeps, then deallocates the VMs:
cd scripts/perf/azureSESSION=<name> BUILD_SHA=88a9168148f6fab3245712ea8dee3dc110c9f778 ./campaign-final.sh --dry-runSESSION=<name> BUILD_SHA=88a9168148f6fab3245712ea8dee3dc110c9f778 nohup ./campaign-final.sh &The dry run lists every cell, the expected hours and the cost. The README in
that directory describes the cell format and summarize.py, which turns a
results directory into cells.csv and summary.md, or prints one cell with
--cell <dir>. This run was trimmed to fit its time limit: 64 KiB batch-1
cells, plain-key batch-64 cells, listener counts 1 and 8, the 64 MiB window arm,
the 4-in-flight arm of the latency curve and the second trial of the sweeps were
dropped.
scripts/perf/azure/v060_tables.py <results-dir> prints the tables on this
page from the cell directories: median of the finished trials, the min to max
spread, and how many trials finished. scripts/perf/azure/v060_charts.py --single <results-dir> --rf3-release <rf3-results-dir> draws the charts from the same
cells into docs-site/public/charts/v060/. Bars are medians, and whiskers span
the trials’ minimum to maximum.
Single broker results
Section titled “Single broker results”This build against v0.6.0-preview.9
Section titled “This build against v0.6.0-preview.9”Before measuring anything else, the campaign ran both builds on the same VMs, two trials each, alternating, with identical clients and settings.
| Shape | preview.9 MB/s | This build MB/s | Change |
|---|---|---|---|
| In-memory 256 B, batch 1, acked, keys spread over all shards | 96 | 104 | +8.0% |
| In-memory 256 B, batch 1, acked, plain keys | 70 | 93 | +32.0% |
| In-memory 256 B, batch 64, acked, keys spread | 2168 | 2268 | +4.6% |
| In-memory 256 B, batch 64, acked, plain keys | 2016 | 2215 | +9.9% |
| In-memory 4 KiB, batch 64, fire-and-forget | 3597 | 3657 | +1.7% |
| Durable 4 KiB, batch 64, acked after fsync | 1410 | 1414 | +0.3% |
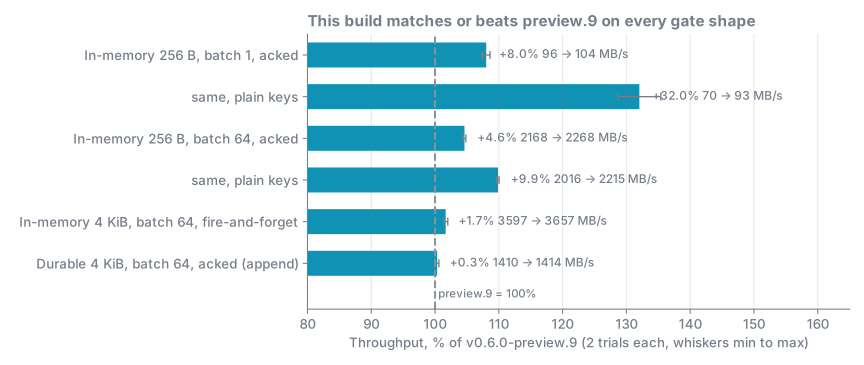
In-memory rows are payload, the durable row is append. The gains come from the four fixes listed under Build. Durable throughput is set by the disk and did not move.
The release build against this build
Section titled “The release build against this build”The release build (6ec23a8f71c90e8aa688415e58adc92647be8b67) adds, among
others, #1421, #1443, #1457, #1459 and #1460 to this build. To check that none of them cost
throughput, the two builds ran on the same VMs in a later session, cell by
cell, alternating, both driven by the release load generator. One trial each.
| Shape | This build | Release | Change |
|---|---|---|---|
| In-memory 4 KiB, batch 64, fire-and-forget | 3650 MB/s | 3685 MB/s | +1.0% |
| In-memory 64 KiB, batch 64, fire-and-forget | 4147 MB/s | 4154 MB/s | +0.2% |
| In-memory 256 B, batch 64, fire-and-forget | 2043 MB/s | 1774 MB/s | -13.2% |
| In-memory 4 KiB, batch 64, acked | 4593 MB/s | 4642 MB/s | +1.1% |
| Durable 4 KiB, batch 64, acked after fsync | 1402 MB/s | 1402 MB/s | 0.0% |
Durable 256 B, one in flight, on_commit, ack p50 / p99 / p999 |
333 / 412 / 458 µs | 348 / 426 / 511 µs | +4.5% at p50 |
Durable 4 KiB, one in flight, on_commit, ack p50 / p99 / p999 |
392 / 467 / 518 µs | 395 / 466 / 508 µs | +0.8% at p50 |
| In-memory 256 B, one in flight, ack p50 / p99 / p999 | 185 / 226 / 246 µs | 175 / 224 / 251 µs | -5.4% at p50 |
| Durable 256 B, batch 1, acked, the defaults cells’ settings | 64 MB/s | 62 MB/s | -2.9% |
| Durable 256 B, one in flight, the defaults cells’ settings, ack p50 / p99 / p999 | 175 / 231 / 253 µs | 173 / 215 / 236 µs | -1.1% at p50 |
Throughput is payload; for latency, lower is better. The verdict: no
regression on any headline shape except 256 B fire-and-forget, which is 13%
slower on the release (#1469). Only small messages are affected; the 4 KiB and
64 KiB rows of the same mode moved by under 1%. The release broker also
dropped almost no UDP datagrams in that cell (1 a second against 68). The 256 B
on_commit ack is 15 µs slower at p50 and 53 µs at p999. That is within the
spread between single trials of this cell (the campaign’s three trials of this
build ran 312 µs at p50, this session’s 333 µs), so it is not a finding on one
trial. It is a separate watch item from #1469.
The A/B did not repeat every shape. In particular it did not repeat in-memory 256 B batches of 64 acked, the 8.78 M messages a second row below, so that figure has no release-build measurement.
The headline figures on this page come from the campaign session, not this one, because this session’s VMs ran 0 to 4% faster for the same build: acked 4 KiB batches at 4593 against 4403 MB/s, fire-and-forget 4 KiB at 3650 against 3624. Comparing the release from this session with this build from the campaign would credit the release with that drift.
With the graceful finish in the release load generator (#1460), sent and accepted bytes now match exactly in these cells, for example 159,886 MB each in the 256 B fire-and-forget cell.
Throughput by shape
Section titled “Throughput by shape”In-memory stream, keys spread over all shards:
| Payload | Batch | Mode | Payload MB/s | Messages/s | Broker cores |
|---|---|---|---|---|---|
| 256 B | 1 | acked | 102 | 398 k | 7.4 |
| 256 B | 1 | fire-and-forget | 103 (101-105) | 402 k | 7.5 |
| 256 B | 64 | acked | 2248 | 8.78 M | 7.5 |
| 256 B | 64 | fire-and-forget | 2023 (2004-2043) | 7.90 M | 7.4 |
| 4 KiB | 1 | acked | 1118 (1104-1131) | 273 k | 7.4 |
| 4 KiB | 1 | fire-and-forget | 1034 | 252 k | 7.3 |
| 4 KiB | 64 | acked | 4403 (4387-4418) | 1.07 M | 7.6 |
| 4 KiB | 64 | fire-and-forget | 3624 | 885 k | 7.7 |
| 64 KiB | 64 | acked | 4105 (4091-4119) | 62.6 k | 7.3 |
| 64 KiB | 64 | fire-and-forget | 4099 (4086-4111) | 62.5 k | 7.4 |
With plain keys instead of spread keys, 256 B batch 1 acked ran at 92 MB/s (91-94).
Durable stream, on_commit (fsynced before the ack), keys spread. The last
column is append against the 1414 MB/s one-job fio baseline:
| Payload | Batch | Mode | Payload MB/s | Append MB/s | Messages/s | Broker cores | Append / fio |
|---|---|---|---|---|---|---|---|
| 256 B | 1 | acked | 53 | 59 | 207 k | 6.7 | 4% |
| 256 B | 1 | fire-and-forget | 80 (79-80) | 89 (88-89) | 313 k | 6.7 | 6% |
| 256 B | 64 | acked | 482 (480-484) | 535 (532-538) | 1.88 M | 3.0 | 38% |
| 256 B | 64 | fire-and-forget | 1261 | 1399 (1395-1403) | 4.93 M | 6.3 | 99% |
| 4 KiB | 1 | acked | 327 (326-328) | 329 | 80 k | 4.2 | 23% |
| 4 KiB | 1 | fire-and-forget | 743 (740-746) | 749 (746-752) | 181 k | 5.4 | 53% |
| 4 KiB | 64 | acked | 1399 | 1411 (1406-1416) | 342 k | 3.7 | 100% |
| 4 KiB | 64 | fire-and-forget | 1445 (1434-1456) | 1455 (1444-1466) | 353 k | 4.1 | 103% |
| 64 KiB | 64 | acked | 1482 (1476-1488) | 1482 (1477-1487) | 22.6 k | 3.4 | 105% |
| 64 KiB | 64 | fire-and-forget | 1518 (1508-1527) | 1519 (1510-1528) | 23.2 k | 4.2 | 107% |
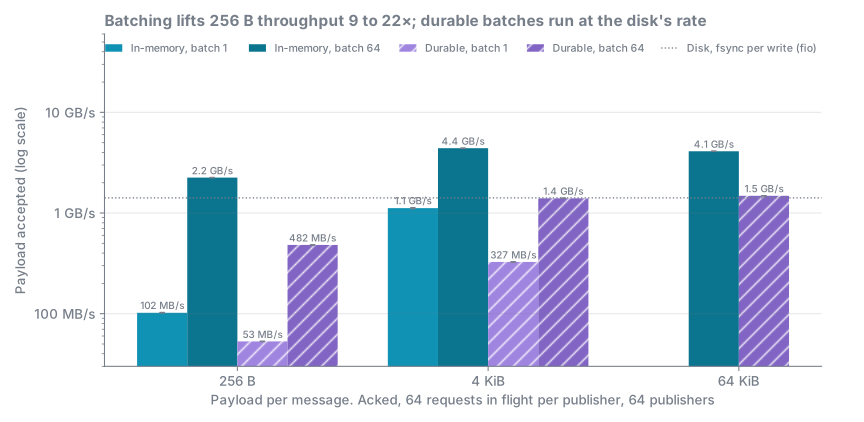
Batching is what pays for small messages: 64 records per request lift 256 B throughput 22 times in memory and 9 times durable. Large durable batches stop at the line, which is the disk.
What the two tables show:
- Large durable batches run at the disk’s rate. From 4 KiB batches up,
append is within a few percent of what
fiowrites with an fsync after each write. It is slightly above the one-job figure because Felix has several writes in flight;fiowith four jobs reached 1467 to 1480 MB/s. The broker uses under half its cores. - Small messages are bound by CPU per message. Every in-memory cell and the durable batch-1 cells use 6.7 to 7.7 of the 8 cores. At 256 B batch 1 the broker handles about 400 thousand publishes a second in memory and 207 thousand durable. Batching 64 records per request multiplies the in-memory rate by 22.
- Durable 256 B batches, acked, stop at 38% of the disk and 3 cores. Neither the CPU nor the disk is the limit in that cell, and the fire-and-forget cell of the same shape reaches the disk. We have not yet found what limits the acked one.
- Fire-and-forget is slower than acked for 4 KiB batches in memory: 3.6 against 4.4 GB/s. The next section explains the likely cause.
Lossless throughput, and why fire-and-forget trailed acked
Section titled “Lossless throughput, and why fire-and-forget trailed acked”For in-memory 4 KiB batches of 64, these are the lossless rates on this build:
| Mode | Payload MB/s | Shed | UDP drops/s |
|---|---|---|---|
Fire-and-forget, waiting for room (FELIX_PUB_INGRESS_WAIT=1) |
3624 | 0.0% | 866 (859-961) |
| Acked, 64 requests in flight per publisher | 4403 (4387-4418) | 0.0% | 961 (954-967) |
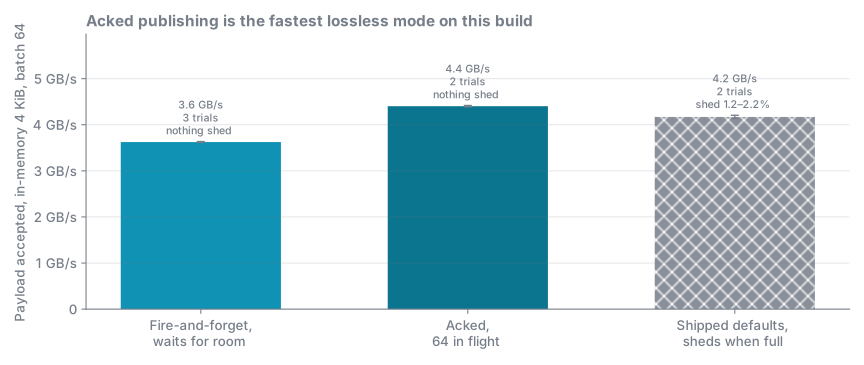
On this build, acked publishing is the fastest way to lose nothing. The defaults go faster than fire-and-forget with waiting only by dropping messages.
Fire-and-forget should be the faster of the two, because the broker sends no acks. It is not, and the cause is not yet known.
The first suspect was a defect in this build (#1416). When the ingress queue was full, a publish waiting for room was awaited inside the control stream’s read loop, so the loop stopped reading the whole QUIC stream, not just that one publish. The release build fixes it (#1443): a publish that finds the queue full parks on its own and the loop keeps reading. In the release comparison the release ran fire-and-forget 4 KiB at 3685 MB/s and acked at 4642, so the gap remains, and the stall was not its cause.
The shipped defaults show what happens without the wait. With
FELIX_PUB_INGRESS_WAIT unset the broker sheds instead of waiting. It then
accepted 4169 MB/s, and the kernel dropped 26 datagrams a second instead of
866, at the cost of 1.2 to 2.2% of the messages.
Unloaded latency
Section titled “Unloaded latency”One publisher on one generator, one publish in flight, batch 1, one subscriber on the same stream. Three trials each; each number is the median of the trials.
| Stream | Payload | Ack p50 / p99 / p999 µs | Delivery p50 / p99 / p999 µs |
|---|---|---|---|
Durable, on_commit (fsynced before the ack) |
256 B | 312 / 393 / 437 | 313 / 392 / 434 |
Durable, on_commit |
4 KiB | 375 / 442 / 488 | 401 / 485 / 525 |
Durable, periodic (fsync every 250 ms) |
256 B | 180 / 220 / 246 | 173 / 228 / 253 |
Durable, periodic |
4 KiB | 197 / 253 / 294 | 214 / 266 / 315 |
| In-memory | 256 B | 163 / 202 / 237 | 155 / 197 / 229 |
| In-memory | 4 KiB | 183 / 219 / 249 | 181 / 222 / 251 |
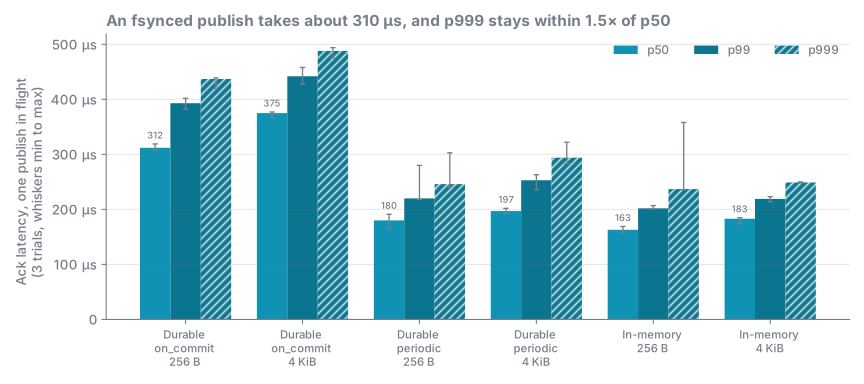
The fsync costs about 130 µs at 256 B and 180 µs at 4 KiB, the difference
between the on_commit and periodic rows. The tail is tight: the p999 is
within 50% of the p50 in every row.
Delivery to a durable stream’s subscriber happens after the record is durable,
so with on_commit a subscriber never sees a record that a crash could take
back. That is why durable delivery tracks the ack rather than coming before it.
Latency against offered load
Section titled “Latency against offered load”The same 64 publishers as the throughput cells, batch 1, acked, with 1 or 16 requests in flight per publisher instead of 64. The 64 column repeats the throughput matrix. Ack p50 / p99:
| Stream | Payload | 1 in flight | 16 in flight | 64 in flight |
|---|---|---|---|---|
| In-memory | 256 B | 328 / 651 µs | 2.74 / 6.59 ms | 10.5 / 17.5 ms |
| In-memory | 4 KiB | 403 / 775 µs | 3.35 / 11.9 ms | 14.3 / 31.4 ms |
Durable, on_commit |
256 B | 1.33 / 3.10 ms | 8.72 / 18.4 ms | 18.1 / 37.8 ms |
Durable, on_commit |
4 KiB | 2.00 / 4.22 ms | 14.7 / 27.6 ms | 48.5 / 79.7 ms |
Payload at the same depths:
| Stream | Payload | 1 in flight MB/s | 16 in flight MB/s | 64 in flight MB/s |
|---|---|---|---|---|
| In-memory | 256 B | 48 | 89 | 102 |
| In-memory | 4 KiB | 625 | 1043 | 1118 |
Durable, on_commit |
256 B | 12 | 29 | 53 |
Durable, on_commit |
4 KiB | 124 | 276 | 327 |
Every cell follows Little’s law. At one in flight there are 64 requests outstanding. In-memory 256 B completes 188 thousand a second, which gives 341 µs, and the measured p50 is 328 µs. In memory, one request in flight per publisher already keeps 7.3 of the 8 cores busy, so going to 16 adds little throughput and multiplies the wait. Durable messages gain more from depth because group commit lets more of them share each fsync: durable 4 KiB grows from 124 to 327 MB/s between 1 and 64 in flight.
Read across a row, this is the trade-off an application chooses. A publisher that needs sub-millisecond acks keeps few requests in flight. One that needs throughput keeps many and accepts the wait.
Shipped defaults against the durability profile
Section titled “Shipped defaults against the durability profile”The main campaign runs what we call the durability profile: acks after the write, publishers wait for room, io_uring on. These cells run the same loads with the measured build’s defaults instead: ack on accept, no waiting, io_uring off. Two trials each.
| Load | Durability profile | Defaults |
|---|---|---|
| In-memory 4 KiB, batch 64, fire-and-forget | 3624 MB/s payload, nothing shed | 4169 (4133-4205) MB/s payload, 1.2 to 2.2% shed |
| Durable 4 KiB, batch 64, acked | 1411 MB/s append | no result: publishes refused (below) |
| Durable 256 B, batch 1, acked | 59 MB/s append, ack p50 18.1 ms | 74 (73-74) MB/s append, ack p50 4.1 ms, p99 99 ms |
| Durable 256 B, one publish in flight | ack 312 / 393 / 437 µs, delivery 313 / 392 / 434 µs | ack 160 / 200 / 217 µs, delivery 294 / 376 / 419 µs |
Durable 256 B, one publish in flight, release build with ack on accept forced (FELIX_ACK_ON_COMMIT=0), not its default |
ack 173 / 215 / 236 µs, delivery 303 / 379 / 424 µs (one trial) |
Fire-and-forget under overload. With the defaults, the broker drops a
fire-and-forget publish that arrives while its ingress queue or byte budget is
full, and keeps reading. The publisher is not told. Delivery is at most once.
The broker then accepts 15% more payload than when publishers wait, and loses 1
to 2% of messages. The measured build has no ingress metrics compiled in, so
the shed comes from the load generators’ sent bytes against the broker’s
accepted bytes, and it includes the small end-of-run gap described under Sent
against accepted. With FELIX_PUB_INGRESS_WAIT=1 the
publisher waits for room instead and nothing is lost. Pick the second if a lost
message matters to you.
Acked publishes under overload. With the defaults, an acked publish that
finds the byte budget full is refused with an error: “publish ingress byte
budget exhausted”. The application gets the error and decides whether to send
again. Felix does not retry it for you. The load generator treats any refused
publish as fatal, so both trials of the durable 4 KiB cell stopped within
seconds, as soon as the disk fell behind. FELIX_PUB_INGRESS_WAIT plays no
part here: it applies only to fire-and-forget. What paced the durability
profile’s run to the disk, at 1.41 GB/s, is ack after the write
(FELIX_ACK_ON_COMMIT=1): an acked publish that finds the broker full then
waits for room, up to FELIX_PUBLISH_QUEUE_WAIT_MS (2000 ms by default),
before it is refused. v0.6.0 acks durable publishes after the write by
default, so a durable acked publish gets that wait without any setting; an
in-memory acked publish is still refused at once unless
FELIX_ACK_ON_COMMIT=1 is set. If you publish faster than the broker can
take, handle the refusal.
What an ack means in these cells. With ack on accept, the 160 µs ack says
the broker has the message, not that it is on disk. The delivery time of 294 µs
is later in the path: the broker hands a durable record to subscribers only
once it is durable, which with on_commit means fsynced. The release row runs
the same settings on the release build: it sets ack on accept explicitly, so
it shows the release’s cost for the same work, not the release’s defaults, and
its 173 µs is not the release’s default latency.
v0.6.0 acks a durable publish after the write by default (#1421, #1422), and
its default fsync is periodic. A durable stream with no settings therefore
acks once the record is written to the log and fsyncs on the 250 ms timer,
which is the periodic row of Unloaded latency: 180 µs
at p50 for 256 B.
Sent against accepted
Section titled “Sent against accepted”In the cells where publishers wait for room, the load generators’ sent bytes and the broker’s accepted bytes agree to within -0.2% and +0.4%. The remainder is an artifact of how the measured load generator ended a cell: at the deadline it closed its connections with publishes still in flight, so some bytes it counted as sent never reached the broker. #1460 makes it stop issuing at the deadline, wait for outstanding acks, and finish every publisher, so sent equals accepted. The fix landed after this campaign, so the numbers here carry the small gap.
The earlier 4.1 GB/s figure
Section titled “The earlier 4.1 GB/s figure”The site previously quoted 4.1 GB/s for in-memory 4 KiB fire-and-forget. To check it, the campaign ran the load generator that produced that figure next to the current one, on this build, with publishers waiting for room:
| Load generator | Trial 1 | Trial 2 |
|---|---|---|
| Current | 3620 MB/s, 744 UDP drops/s | 3619 MB/s, 957 UDP drops/s |
| The one behind the 4.1 GB/s figure | 3556 MB/s, 1111 UDP drops/s | 4081 MB/s, 108 UDP drops/s |
The older generator reached about 4.1 GB/s once and about 3.6 GB/s once. The run that reached it is also the one where the broker’s socket buffers almost never overflowed. The default-settings cell above, at 4.2 GB/s with 26 drops a second, shows the same pattern. So 4.1 GB/s is real, but it does not reproduce every time under the conditions on this page, and we report the number that does.
Listener sweep
Section titled “Listener sweep”FELIX_QUIC_LISTENERS sets how many client-facing QUIC endpoints the broker
binds, each with its own UDP socket. On in-memory 4 KiB batch 64
fire-and-forget, one trial each:
| Listeners | Payload MB/s | Broker cores | UDP drops/s |
|---|---|---|---|
| 2 | 2918 | 5.3 | 54 |
| 4 (the default on 8 cores) | 3631 | 7.7 | 877 |
Going from two listeners to four adds 24% and lets the broker use all its cores. The 1 and 8 listener arms were trimmed from this run.
Receive windows
Section titled “Receive windows”FELIX_BROKER_PUB_CONN_RECV_WINDOW and FELIX_BROKER_PUB_STREAM_RECV_WINDOW set
how much a publisher may send before the broker grants more credit. On the same
cell, one trial each, the default ran at 3626 MB/s and 32 MiB windows at 3588
MB/s. Larger windows do not help this shape.
UDP drops
Section titled “UDP drops”The broker’s kernel counts datagrams it dropped because a socket receive buffer
was full (udp_rcvbuf_errors). QUIC retransmits a dropped datagram, so a drop
costs bandwidth and some latency, but no record is lost. Per second, over the
steady window:
| Cells | Drops/s | Share of inbound datagrams |
|---|---|---|
| Every batch-1 cell except durable 4 KiB fire-and-forget | 0 | 0 |
| In-memory 256 B batch 64 | 0 acked, about 25 fire-and-forget | under 0.1% |
| In-memory 4 KiB batch 64, acked and fire-and-forget | 866 to 961 | 0.6 to 0.7% |
| In-memory 4 KiB batch 64, shipped defaults | 26 | 0.02% |
| Durable 4 KiB batch 64, fire-and-forget | 660 | about 1% |
| Durable 64 KiB batch 64, fire-and-forget | 2851 | about 5% |
Drops appear in the batch-64 cells with 4 KiB and larger payloads, where the most bytes arrive per second, and they fall to 26 a second when the broker sheds instead of waiting. Read them next to any 4 KiB or 64 KiB result.
Felix against NATS JetStream
Section titled “Felix against NATS JetStream”The comparison follows these rules, because a benchmark that favors one side is not worth publishing:
- NATS runs at its best, not its defaults. Its stream count was tuned first, because JetStream spreads work by stream the way Felix spreads it by shard. At 48, 96 and 192 streams it ran within 2% (file storage 114 to 116 MB/s, memory 146 to 149 MB/s), so every pair uses 48 streams, the same as Felix’s shards.
- Same VMs. NATS server 2.15.0 and natscli 0.5.0 replaced the Felix broker on the same L8as_v4 and the same four D4as_v5 generators, with TLS. JetStream’s store is on the same RAID0 volume.
- Same load: 16 clients per generator, 64 in all, and the same payloads.
- Cells are interleaved. Felix runs first on odd trials and NATS on even ones. Before each cell the other system is stopped and its store removed, and the volume is trimmed.
- Every durability difference is stated next to the number.
- Where NATS is faster, the page says so.
How each pair is matched, and where it still differs
Section titled “How each pair is matched, and where it still differs”The two systems are not built the same way, so no pair is a perfect copy of the other. Each pair is matched on what the publisher is promised when it gets its answer, as closely as the two systems allow. The table says what each side does, and the last column says what still differs. Read every ratio together with its row.
| Pair | Felix | NATS JetStream | What still differs |
|---|---|---|---|
| Durable, one at a time | Durable stream, batch 1, 64 in flight. The ack comes after the record is fsynced (on_commit). |
File stream with sync_interval: always, nats bench js pub fast with batch 1 and 64 outstanding acks. The ack comes after the write is fsynced. |
Both fsync before the ack. Felix group-commits the writes that are waiting together into one fsync. |
| Durable, 64 per request | Batch of 64 records in one request, 64 requests in flight, fsynced before the ack. | File stream, sync_interval: always, nats bench js pub atomic with batches of 64. |
nats bench sends one atomic batch at a time per client, where Felix keeps 64 in flight. NATS’s atomic batch is all-or-nothing. A Felix batch is acked or refused as one unit, but it is not atomic on disk: a crash partway through writing it can leave its first records in the log, unacknowledged (“Producer marks” in docs/storage-format.md). An idempotent producer’s re-send completes such a batch. |
| Periodic fsync, 64 per request | Durable stream with periodic fsync every 250 ms, the default interval. The ack comes before the fsync. |
File stream with the default sync, every 2 minutes (defaultSyncInterval in nats-server’s filestore.go). nats bench js pub fast with batch 64 and 16 outstanding. The ack comes before the fsync. |
Both can lose the last interval’s writes on a power loss, and NATS’s interval is 480 times longer. NATS keeps 1,024 messages outstanding per client against Felix’s 4,096. |
| In memory | In-memory stream, batch 1, 64 in flight, acked. | Memory-storage stream, nats bench js pub fast with batch 1 and 64 outstanding. |
Neither touches disk. A NATS memory stream keeps every message up to its limits. A Felix in-memory stream keeps only a replay ring per shard (below). |
| Fire and forget | Unacked publish, batch 64, into the same in-memory stream. | Core NATS publish to 48 subjects, nats bench pub core. The server routes the message and keeps nothing. |
Both are at-most-once with nothing on disk, and neither side had a subscriber. Felix still routes each record to its shard and puts it in the replay ring; core NATS finds no interest and discards it. |
A Felix in-memory stream has no log. Each shard keeps its newest records in a
replay ring: by default the last 1,024 records, and at most 64 MiB of payload
(FELIX_REPLAY_RING_MAX_BYTES), oldest out first. A subscriber that resumes
from a position still in the ring catches up from it; one that resumes from an
older position is refused as too old. Live delivery never depends on the ring.
Two differences apply to every pair:
- Transport and client. Felix uses QUIC with TLS and its Rust load
generator. NATS uses TCP with TLS and
nats bench(Go). Both are each system’s own tool, run with the same publisher count and payload. - What is counted. Both rates are payload at the server: the records the server stored times the payload size, or for core NATS the publish requests it received. That keeps each side’s per-record framing out of the comparison.
Results
Section titled “Results”Payload MB/s at the server, the mean of two trials per pair, and the server’s CPU in cores:
| Pair | Payload | Felix MB/s | Felix cores | NATS MB/s | NATS cores | Faster |
|---|---|---|---|---|---|---|
| Durable, one at a time | 256 B | 52.5 | 6.7 | 16.1 | 3.3 | Felix, 3.27× |
| Durable, one at a time | 4 KiB | 367 | 4.5 | 204 | 4.1 | Felix, 1.79× |
| Durable, 64 per request | 256 B | 543 | 3.3 | 36.9 | 3.4 | Felix, 14.8× |
| Durable, 64 per request | 4 KiB | 1430 | 3.8 | 408 | 4.0 | Felix, 3.50× |
| Periodic fsync, 64 per request | 256 B | 1118 | 5.7 | 118 | 3.0 | Felix, 9.48× |
| Periodic fsync, 64 per request | 4 KiB | 1432 | 3.8 | 1148 | 5.0 | Felix, 1.25× |
| In memory | 256 B | 102 | 7.4 | 85.5 | 5.3 | Felix, 1.19× |
| In memory | 4 KiB | 1130 | 7.4 | 923 | 6.0 | Felix, 1.22× |
| Fire and forget | 256 B | 2046 | 7.4 | 2736 | 7.4 | NATS, 1.34× |
| Fire and forget | 4 KiB | 3621 | 7.7 | 5033 | 6.7 | NATS, 1.39× |
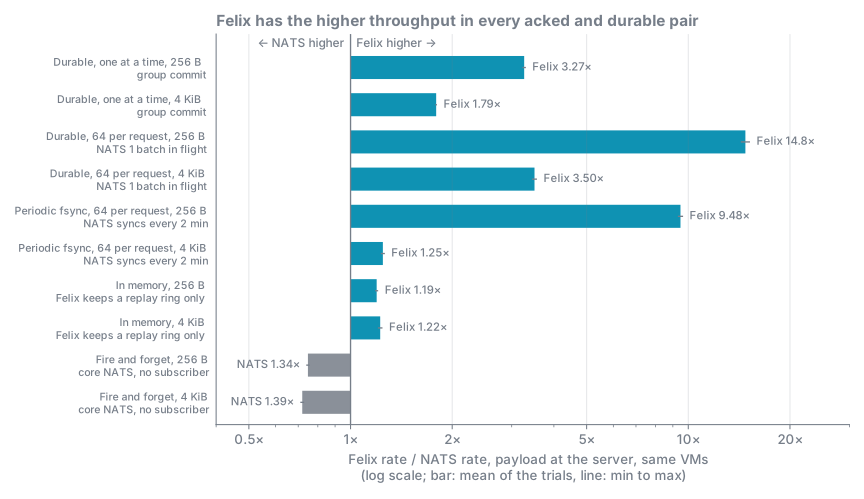
Each bar is labelled with the difference that matters most for reading it. The full list of what still differs is in How each pair is matched.
What the pairs show:
- Durable writes are where Felix leads most. With an fsync before every
ack, group commit lets Felix’s outstanding requests share fsyncs. In the
batch pair, Felix also keeps 64 batches in flight where
nats benchsends one atomic batch at a time, so part of the 14.8× comes from the publisher’s window rather than the server. In the 4 KiB batch pair Felix runs at the disk’s rate on under 4 cores. - Periodic fsync narrows the gap at 4 KiB to 1.25×, as neither side waits on the disk. At 256 B Felix still leads by 9.5×.
- In memory is close, 1.2× at either payload, and Felix uses more CPU to get there: 7.4 cores against 5.3 to 6.0.
- Core NATS wins fire-and-forget by 1.34 to 1.39×. With no subscriber, core NATS checks for interest and discards, while Felix routes each record to its shard and keeps it in the ring.
One Felix fire-and-forget 256 B trial had a shorter steady window, 46 seconds instead of 72, because its generators finished unevenly. It measured 2041 MB/s against 2051 for the other trial, and both are in the mean.
Latency pairs
Section titled “Latency pairs”One publisher, one publish in flight, batch 1, one subscriber, on the same VMs and with the same pairings as above. Felix ran this build. One trial each, the first of each pair:
| Pair | Payload | Felix ack p50 / p99 / p999 | NATS ack p50 / p99 / p999 | Felix delivery p50 / p99 / p999 | NATS delivery p50 / p99 / p999 |
|---|---|---|---|---|---|
Fsync before the ack (on_commit / sync_interval: always) |
256 B | 351 / 436 / 486 µs | 280 / 366 / 406 µs | 364 / 449 / 495 µs | 276 / 356 / 408 µs |
| Fsync before the ack | 4 KiB | 416 / 495 / 531 µs | 336 / 401 / 554 µs | 435 / 507 / 550 µs | 369 / 449 / 610 µs |
Periodic fsync (periodic / default sync) |
256 B | 200 / 255 / 282 µs | 173 / 226 / 325 µs | 188 / 242 / 273 µs | 167 / 212 / 315 µs |
| Periodic fsync | 4 KiB | 206 / 259 / 304 µs | 193 / 252 / 484 µs | 223 / 290 / 332 µs | 217 / 272 / 603 µs |
| In memory | 256 B | 168 / 212 / 281 µs | 150 / 209 / 257 µs | 172 / 232 / 282 µs | 153 / 200 / 333 µs |
| In memory | 4 KiB | 191 / 242 / 270 µs | 167 / 230 / 271 µs | 212 / 274 / 295 µs | 214 / 298 / 370 µs |
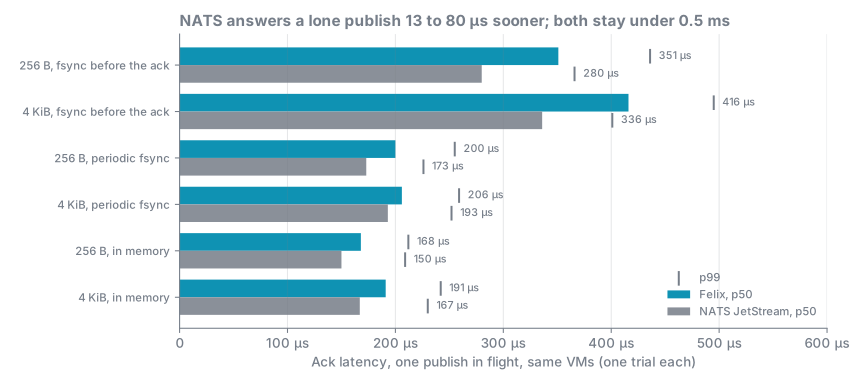
NATS answers a lone publish sooner in every pair, by 13 to 80 µs at p50. The largest gap is with an fsync before the ack: 280 against 351 µs at 256 B. A second trial of that pair measured 279 µs for NATS and 419 µs for Felix, and the campaign’s own three trials of the same Felix cell measured 312 µs, so the Felix figure moves between runs more than the NATS one does. At the tail the two are closer: at 4 KiB NATS’s ack p999 is the longer one in both fsync pairs, and its delivery p999 is longer in five of the six rows. These are one-publish latencies. Under load the throughput pairs are the ones to read.
Core NATS has no Felix pair here, because its publish has no server acknowledgement. The measuring tool times a core publish followed by a flush, which returns in 34 µs at p50 for 256 B and 37 µs for 4 KiB. Delivery to the subscriber takes 827 µs at p50 and 2.82 ms at p99 for 256 B, and 594 µs and 1.24 ms for 4 KiB. A fast return from a fire-and-forget publish says nothing about when a subscriber sees the message.
Three-broker cluster
Section titled “Three-broker cluster”This chapter reports three brokers with a replication factor of 3, on the
release build (6ec23a8f71c90e8aa688415e58adc92647be8b67 of main). A durable
Quorum stream keeps three copies of every record, each fsynced on its broker.
An in-memory stream keeps one: it is not replicated, and each shard lives on
its leader only.
The main measurements ran with the fleet features majority_ack,
generation_start and lease_free_reads not yet finalized. The perf harness
reseeds the cluster before it measures, which restarts the brokers, so the
cluster no longer reads as new and the automatic finalize that a new cluster
performs at its first registration (#1457) does not run. A real new v0.6.0
cluster finalizes them by itself, and the cluster test suite asserts that it
does. The numbers below are therefore those of an unfinalized cluster, which
is also what a cluster upgraded from an older release runs until its operator
finalizes the features. Finalizing changes commit latency most, and Cluster
latency explains why.
Cluster conditions
Section titled “Cluster conditions”| Part | Setting |
|---|---|
| Region | Azure centralus |
| Brokers | 3 × Standard_L4as_v4, 4 vCPU, 32 GiB, one in each availability zone (1, 2, 3) |
| Broker storage | Local NVMe as one md RAID0 on each broker. fio sequential 256 KiB with an fsync after each write, one job: 730 to 735 MB/s |
| Load generators | 4 × Standard_D4as_v5, in zone 1 |
| Control plane | 1 × Standard_D2as_v5, in zone 1 |
| NIC and transport | MTU 3900, QUIC with TLS, as for the single broker |
Broker settings are the single broker’s, except FELIX_QUIC_LISTENERS=2, which
is what an unset value derives on 4 cores. The streams have 12 shards each,
RF=3 and Quorum consistency, and keys spread over every shard. Unless a
section says otherwise, publishers use the cluster client, which sends each
publish straight to its shard’s owner. Each cell waits until no shard is
under-replicated and the stream’s leaders are spread evenly, and durable cells
run on freshly recreated streams. The cells are the same 90-second cells with
the same steady window as above. The headline shapes (batch 1 at 256 B, batch
64 at 4 KiB, and the latency cells) ran two trials; the run was trimmed to fit
its time limit, so the other shapes and the forwarding and cache cells ran one.
An acked durable Quorum publish is answered once a majority of the three
brokers, including the leader, has durably stored it. With on_commit on every
broker, that means fsynced on at least two of them. The third copy follows.
Cluster throughput
Section titled “Cluster throughput”Durable, three fsynced copies of every record. Payload is what the publishers sent. Cluster append is the bytes written to the log on all three brokers together, about three times payload plus framing:
| Payload | Batch | Payload MB/s | Cluster append MB/s | Messages/s | Cores, all brokers | Trials |
|---|---|---|---|---|---|---|
| 256 B | 1 | 65 (64-67) | 218 (214-222) | 254 k | 8.7 | 2 |
| 256 B | 64 | 475 | 1588 | 1.86 M | 9.3 | 1 |
| 4 KiB | 1 | 467 | 1413 | 114 k | 9.1 | 1 |
| 4 KiB | 64 | 656 (654-658) | 1983 (1976-1990) | 160 k | 8.7 | 2 |
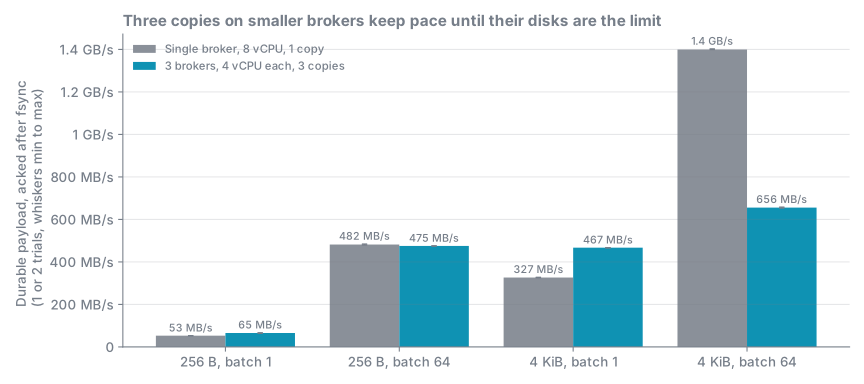
Three copies on three smaller brokers keep pace with one 8-core broker for every shape but the one that is bound by the disk, where the cluster’s disks are half as fast.
In-memory, one copy of each record, the shards spread over the three brokers:
| Payload | Batch | Payload MB/s | Messages/s | Cores, all brokers | Trials |
|---|---|---|---|---|---|
| 256 B | 1 | 117 | 457 k | 10.2 | 2 |
| 256 B | 64 | 2034 | 7.95 M | 7.9 | 1 |
| 4 KiB | 1 | 1395 | 341 k | 10.4 | 1 |
| 4 KiB | 64 | 4621 (4585-4657) | 1.13 M | 7.3 | 2 |
What the tables show:
- Large durable batches run at each broker’s disk. With three copies on
three brokers, every broker writes every record. 1983 MB/s across the
cluster is about 660 MB/s per broker, 90% of what one of these disks writes
in
fiowith an fsync after each write. These disks write about half as fast as the single broker’s, which is why the cluster’s durable payload at 4 KiB batch 64 is below the single broker’s. - Durable small messages and single 4 KiB messages gain from the cluster. 256 B batch 1 runs at 65 MB/s of payload against the single 8-core broker’s 53, and 4 KiB batch 1 at 467 against 327, on three 4-core brokers that each also store the other two’s records.
- In memory, three 4-core brokers beat one 8-core broker: 4.6 GB/s against 4.4 at 4 KiB batch 64, and 1.4 against 1.1 GB/s at 4 KiB batch 1. This is a sharding result: each record is held once, on its shard’s leader.
Cluster latency
Section titled “Cluster latency”One publisher, one publish in flight, batch 1, one subscriber, the cluster client publishing to the shard’s owner. Two trials each:
| Stream | Payload | Ack p50 / p99 / p999 | Delivery p50 / p99 / p999 |
|---|---|---|---|
Durable Quorum, three copies |
256 B | 3.48 / 4.21 / 5.49 ms | 3.46 / 4.19 / 5.49 ms |
Durable Quorum, three copies |
4 KiB | 3.68 / 4.41 / 5.56 ms | 3.71 / 4.47 / 5.59 ms |
| In-memory, one copy | 256 B | 461 / 520 / 560 µs | 450 / 516 / 553 µs |
| In-memory, one copy | 4 KiB | 504 / 560 / 604 µs | 498 / 561 / 601 µs |
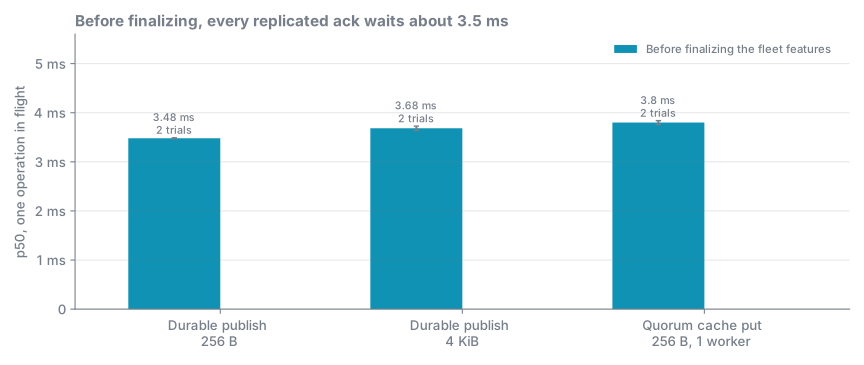
A durable ack takes about 3.5 ms at either payload, so it is set by neither the
disk nor the bytes on the network. Without majority_ack and
generation_start, a Quorum leader’s commit mark moves only when its
followers’ replica report has reached the control plane, so every ack waits
for that round. With the features finalized, the followers’ acknowledgements
move the mark directly, and the control plane is off the path. A new cluster
finalizes them by itself (#1457). An upgraded cluster gets the same by
finalizing them (POST /v1/fleet/features/<feature>/finalize).
The in-memory figures are about 300 µs above the single broker’s. The generators are all in zone 1, so two thirds of the shards’ owners are in another zone.
Quorum cache
Section titled “Quorum cache”A Quorum cache with RF=3, 256 B values. Each worker keeps one operation in
flight. Two trials each; the figures are their means. A put is answered once a
majority holds it, so before finalizing it pays the same control-plane round
as a durable publish:
| Workers | Put ops/s | Put p50 / p99 / p999 | Get ops/s | Get p50 / p99 / p999 |
|---|---|---|---|---|
| 1 | 260 | 3.80 / 5.26 / 5.55 ms | 1109 | 951 µs / 1.32 ms / 1.54 ms |
| 8 | 1515 | 4.82 / 12.2 / 19.9 ms | 2872 | 2.27 / 8.67 / 13.5 ms |
| 32 | 4582 | 5.78 / 25.3 / 43.0 ms | 2982 | 7.39 / 45.8 / 64.6 ms |
These figures are bound by latency: with one operation in flight per worker, throughput is the worker count divided by the latency, as Little’s law says. Puts scale with workers. Gets stop near 3,000 a second between 8 and 32 workers, and we have not yet found why. They show what one operation costs, not what the cache can sustain; a dedicated cache campaign will measure that (#1473).
Forwarding
Section titled “Forwarding”A publish can enter any broker. If that broker does not own the shard, it forwards the publish to the owner over the brokers’ peer connections. The cluster client avoids this by sending each publish straight to the owner. A plain client connected to one broker, or spread over brokers in turn, does not, and two thirds of its publishes take the extra hop.
One publish in flight, 256 B, one trial each:
| Stream | Straight to the owner, ack p50 / p99 / p999 | Through another broker, ack p50 / p99 / p999 |
|---|---|---|
| In-memory | 448 / 532 / 881 µs | 831 / 903 µs / 1.16 ms |
Durable Quorum |
3.42 / 3.97 / 5.10 ms | 3.69 / 5.02 / 6.16 ms |
Under load, with 64 publishers sending batches of 64, 64 in flight each, either straight to the owner or to the brokers in turn so that two thirds of publishes are forwarded. Payload MB/s, one trial for the forwarded cells:
| Stream | Payload | Straight to the owner | Through any broker | Slower by | Cores, all brokers, owner / any |
|---|---|---|---|---|---|
| In-memory | 256 B | 2034 | 864 | 2.4× | 7.9 / 10.6 |
| In-memory | 4 KiB | 4621 | 2897 | 1.6× | 7.3 / 10.6 |
Durable Quorum |
256 B | 475 | 107 | 4.4× | 9.3 / 8.6 |
Durable Quorum |
4 KiB | 656 | 512 | 1.3× | 8.7 / 9.1 |
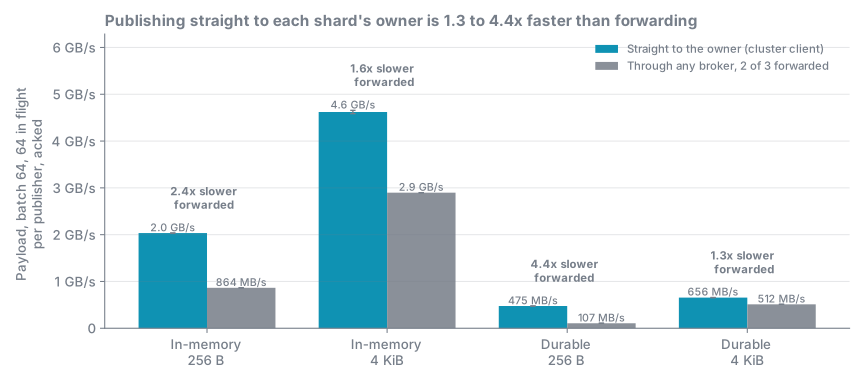
Two costs make forwarding slower.
Every hop is decrypted, re-encrypted and copied. The entry broker decrypts the client’s QUIC packets, encrypts the publish again for the peer connection, and the owner decrypts it once more. In memory that CPU is the limit: with forwarding the brokers used 34 to 44% more CPU (10.6 of 12 cores against 7.3 to 7.9) and moved 1.6 to 2.4 times less payload, so each byte cost 2.3 to 3.2 times as much CPU. A lone forwarded in-memory publish takes 383 µs longer.
A forward holds its shard for the quorum wait. To keep each shard’s records in order, the entry broker sends a shard’s next forward only after the owner has answered the last, and the owner answers a durable publish once it has committed. So each shard has at most one forward outstanding from each of the other two brokers: 24 for 12 shards. By Little’s law, 24 forwards held for a commit of at least 3.5 ms cap forwarded traffic at about 6,900 batches a second, while publishers sent straight to the owner keep 64 batches each in flight. The 256 B cell forwarded about 4,400 batches a second, under that cap, and ran 4.4 times slower than going straight to the owner. At 4 KiB the disk is already close to its limit, so the cap matters less and the gap is 1.3 times.
Use the cluster client. It learns each shard’s owner and publishes there, so it pays neither cost. See Which client to use.
This test is also what found the deadlock between forwards and replication on the brokers’ peer lanes (#1458). It is fixed (#1459), and the durable forwarding cells now complete.
Failover
Section titled “Failover”One trial, before finalizing the fleet features. 64 publishers on four
generators sent durable 4 KiB batches of 64, 64 in flight each, through the
cluster client to a 12-shard Quorum stream. 40 seconds into a 150-second
run, one broker was killed with kill -9, held down for 45 seconds and
restarted. Cluster append is the bytes written to the log on all three brokers
together:
| Measure | Result |
|---|---|
| Cluster append before the kill | 1963 MB/s |
| While the broker was down (45 s) | 18% of that on average; under 10% for 20 of the 45 seconds |
| After the restart | about 1.45 GB/s, three quarters of the pre-kill rate, from 18 s after the restart to the end of the run; it never returned to 90% |
| Records acked | 14,796,608 |
| Records whose send failed with an error | 264,256, 1.8% of those sent |
| Client retries and reconnects | 2,823 retries, no reconnects |
| Batch ack p50 / max over the whole run | 1.8 to 2.0 s / 48.6 to 50.6 s, across the four generators |
| Every shard back to three copies | 65 s after the run ended |
This trial does not show whether any acknowledged record was lost. The check compares each shard’s stored record count, before and after the run, with the records acked to it, and neither inspection snapshot completed, so the check has no result.
What limits each shape
Section titled “What limits each shape”These are the limits we measured or can explain. They tell you what to expect on hardware that is not this VM.
Small messages are bound by CPU per message. At 256 B the broker spends its cores on per-message work: parsing, scheduling, ack writes and QUIC packet handling. Throughput in MB/s is low, in messages per second it is high, and it scales with cores and with how well the client batches. Batch 64 divides the per-message cost over many records. Expect throughput to follow single-core speed and core count.
Large in-memory messages are bound by the CPU spent on bytes. At 4 KiB batch 64 the cost is decryption, copying and UDP receive. Adding listeners spreads UDP receive across cores. Expect it to follow core count and NIC bandwidth.
Large durable messages are bound by the disk. Durable 4 KiB and 64 KiB batches run at the device’s sequential write rate with fsync. On a slower disk, durable throughput follows the disk, with group commit keeping fsyncs few. A cloud disk with a lower write cap lowers it directly. With replication, every broker that holds a copy writes every record, so the cluster’s durable rate follows the slowest disk that holds a copy.
Durable small messages are bound by commit latency. A publish waits for its fsync. More publishes in flight per commit raise throughput until CPU takes over.
The NIC and the path. A larger MTU means fewer packets per byte. The campaign used MTU 3900 because the Azure virtual network accepts it. At the default 1500 the same load needs more than twice the packets.
Per-shard publish streams are a trade-off. A client can give each shard of a keyed stream its own QUIC publish stream so that a stalled shard (a quorum wait, a dead follower) does not hold up healthy shards on the same connection. Streams cost broker work. In-memory 256 B batch 1 acked with keys over 48 shards on the 8 vCPU broker, measured during the investigation at an ingress queue depth of 1024, before the final build (#1417):
FELIX_PUB_SHARD_STREAMS |
MB/s |
|---|---|
| 0 (pooled streams) | 162 |
| 4 | 125 |
| 16 | 97 |
Up to that many streams are opened per connection, assigned first come, first served by shard on that connection. A client with 4 streams and 48 shards puts the first four shards it publishes to on their own streams; later shards share. A stalled shard then holds up only the shards that share its stream. The default of 4 is the compromise. Set the variable to the stream’s shard count for full isolation, or 0 for the most throughput. #1417 tracks opening dedicated streams only for shards that stall.
Core shards are neutral. Once the wake-up problem described below was fixed, the number of broker core shards no longer changed throughput in these cells.
Known issues
Section titled “Known issues”- 256 B fire-and-forget is 13% slower on the release than on the campaign build, with the 4 KiB and 64 KiB rows unchanged (#1469).
- Watch item: the 256 B
on_commitp50 was 4.5% slower on the release in a single trial, within the spread between trials of that cell. It is not part of #1469. - Fire-and-forget trails acked publishing. Lossless, in memory, 4 KiB batches of 64: 3.6 GB/s fire-and-forget against 4.4 GB/s acked. The cause is not yet found. The release comparison ruled out the connection stall (#1416).
- The cache figures are bound by latency. They measure one operation in flight per worker on the RF=3 cluster. A dedicated campaign will measure cache throughput on a single broker and on a cluster (#1473).
- Forwarding costs throughput on a cluster. A publish that enters a broker that does not own its shard is 1.3 to 4.4 times slower under load than one sent straight to the owner. Use the cluster client (Forwarding).
What the campaign found and fixed
Section titled “What the campaign found and fixed”Running Felix at full load on real hardware for days found defects that the test suites had not. Each one below is fixed on main.
| Issue | What failed | Impact | Fix |
|---|---|---|---|
| #1406 | Unbatched publishes cost about 55% more broker CPU per message than in an earlier campaign. | In-memory 256 B batch 1 acked fell from 136 to 87 MB/s on the same broker. | A thundering herd on the ingress queue, a queue too small for the load, too many per-shard streams by default, and a metric lookup per publish: #1414, #1415, #1418, #1419. See How we got here. |
| #1416 | A publish waiting for room in a full ingress queue stopped the control stream’s read loop, stalling every publish on the connection. | One full shard queue stalled every publish stream on the connection. | #1443 parks the waiting publish and keeps the loop reading. |
| #1435 | A broker that took a shard by an operator move kept serving it after the stream was deleted. | A recreated stream could not move a shard to that broker, and the stuck move held the cluster’s only move slot for 30 minutes. | #1437 replaces the held shard with the recreated stream’s first assignment. |
| #1447 | Recreating a deleted stream under the same name reopened its old logs on the followers, which then held committed records the new leader did not have. | The followers halted as diverged and the stream’s Quorum writes stalled. The halt is the safety check working: a follower refuses to drop a record it holds as committed. |
#1448 refuses to reuse a deleted name until stream incarnations are finalized. #1449 finalizes incarnations on every new cluster, so a recreated stream gets directories of its own. |
| #1429 | Placement balanced leaders across the cluster, not per stream, so one stream’s 12 leaders could land 1/1/10. | A deployment dominated by one stream got about a third of the cluster’s write capacity for it. | #1442 spreads each stream’s leaders, not only the cluster’s. |
| #1433 | The cluster client could wait forever: finishing a publisher and reconnecting had no timeout. | Load generators hung for over 90 minutes when a leadership move stalled. | #1441 bounds finish and broker connects. |
| #1434 | A fenced shard move had no timeout if its leader never reported drained. | A move frozen by a placement pause left a durable shard unable to commit for an hour. | #1440 pins that a pause never holds a started move, and #1444 gives a stuck fence back to its leader after a timeout. |
| #1458 | Forwarded durable Quorum publishes and replication shared the same peer lanes, and the owner held a lane for the whole quorum wait. |
When two brokers forwarded to each other, neither’s replication could move. No publish succeeded for 30 seconds, and the cluster recovered by itself 5 minutes after the load stopped. Clients sending straight to the owner were not affected. | #1459 keeps replication off peer streams that forwards hold. |
| #1457 | A new cluster finalized only the incarnation features, leaving majority_ack and generation_start off. |
Durable Quorum acks on a new cluster waited for a control-plane round: about 3.5 ms with one publish in flight. |
#1457 finalizes every feature its brokers report on a new cluster, except publisher_principal. |
How we got here
Section titled “How we got here”A performance page that only reports the good outcome hides what the numbers depend on. This is what happened between the first single-broker campaign and this one.
The first numbers. An earlier campaign measured in-memory 256 B batch 1 acked at 135.8 MB/s on a single 8 vCPU broker, with the broker CPU-bound at 7.35 cores. The same cell on v0.6.0-preview.9 measured 87.0 MB/s at 7.36 cores, about 40% lower and about 55% more broker CPU per message. Batched cells fell too: 256 B batch 64 acked from 2521 to 1905 MB/s.
Wrong turns on the way. The first suspect was the per-shard publish streams
that landed in between. They quadruple the number of inbound datagrams, so the
theory was reasonable, but changing them moved throughput by under 3% in the
comparison cells. A second theory held that the broker’s cost is per inbound
datagram and the client was sending thinner packets. Three client changes built
on it (a frame-draining writer, a concurrent ack reader and a linger) all
measured worse on Azure and were dropped. Single-trial noise in these cells was
larger than assumed: one build measured between 66 and 94 MB/s across runs.
Durable cells also looked 35 to 38% lower for a day. That was the disk, not
Felix. The VM had been deallocated and came back with a local NVMe that ran
at 18% of its spec in eastus2. A fio baseline on the data volume showed it,
and the campaign moved to westus3, where the device matched the original
baseline (1416 against 1427 MB/s). On that disk durable cells were not regressed:
256 B batch 1 went from 27.1 to 34.4 MB/s and 4 KiB batch 1 from 268 to 354
MB/s.
The load shape. A bisect over the load generator’s own history, with the broker fixed, landed on the commit where the generator started learning the shard count from the broker and spreading key names evenly over every shard (#924). Nothing else in the client changed. On one binary, in-memory 256 B acked: batch 1 ran at 108 MB/s with the old plain keys and about 62 to 64 MB/s with spread keys; batch 64 ran at 2208 to 2320 against 1672 to 1710 MB/s. The original campaign’s key pattern was lumpy, and lumpy load lets a backlog build up that makes each wake-up and lock acquisition serve several messages. Evenly spread load pays for them one message at a time. The 40% was real for spread keys, and it was a property of the broker, not of the measurement.
The broker defects. Profiling the same broker with plain and spread keys showed where the extra cost went. A publish woke an executor every time, locked the partition twice, and registered a metric through a hash lookup on every publish. Separately, the default ingress queue held 256 jobs while about 4096 publishes were in flight. When it filled, every blocked publisher was woken whenever any slot freed, so one freed slot woke thousands of submitters that mostly went back to sleep. That is the thundering herd pattern we had already fixed once for a different queue (#511). The fix admits one waiting publisher per freed slot, oldest first, with the fair queue still deciding who goes next (#1414). A full queue also stopped the connection’s control loop from reading its stream, which stalled every stream on that connection (#1416, fixed by #1443).
Queue capacity. Raising the default depth to 512 per executor (#1415) gave the full gain: 256 B batch 1 acked went from 95 MB/s at depth 64 to 163 MB/s at 512, with p50 dropping from 12.6 ms to about 7.5 ms, and 1024 gave the same throughput. Throughput at 4 KiB batch 64 stayed flat at 4.69 to 4.72 GB/s at every depth, while the 4 KiB p99 fell from a range of 458-597 ms at depth 64 to 358-384 ms at 512. We did not derive the capacity from the byte budget. A queued job costs 2 KB or more with spread keys against a 512 B charge, the per-tenant fairness reserve cannot be reached under a byte-derived capacity, and overload becomes invisible because shedding starts about 500 times later.
Shard streams. With the queue fixed, the remaining gap was the shard stream cost in the table above, so the default dropped from 16 to 4 (#1418).
Lessons for measuring.
- Baseline the hardware every session. A disk at 18% of its spec looked like a Felix regression for a day.
- A benchmark’s load shape is part of the result. Changing how keys are spread moved throughput 40%, more than any code change in the range.
- Compare against a recorded configuration, not a remembered number, and rerun the old build on the new VMs.
- Run each cell more than once. One cell moved 66 to 94 MB/s between runs of the same build.
- A theory that fits the data can still be wrong. Measure the change before building on the theory.
- Report saturation latency as queueing time, and unloaded latency as latency.